
Introduction
Environmental monitoring on a construction or infrastructure project isn’t just about recording data – it’s about understanding what that data means in context. A noise reading of 65 dB means something very different during demolition than it does during background conditions or project completion.
That’s where project phase comparison comes in. By comparing data across different stages of your project, you can demonstrate compliance, identify trends, manage community impact and build a defensible audit trail – all from one platform.
What Is Project Phase Comparison?
Project phase comparison is the ability to compare environmental monitoring data collected during different stages of a project — for example:
- Background / pre-construction — baseline conditions before works begin
- Construction phase — active works including excavation, piling, demolition or blasting
- Completion / post-construction — conditions after works are finished
By setting these phases within Pro Link, you can directly compare readings across each stage using the comparison table – showing how your activities have affected (or haven’t affected) the surrounding environment.
In Pro Link, this is built directly into the reporting and data processing tools. Set your project phases, define your baseline period and Pro Link will automatically compare current readings against historical phase data — in real time.
What the Comparison Table Shows
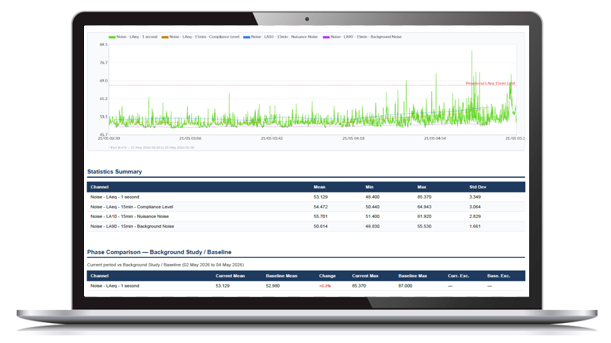
Pro Link’s phase comparison table gives you a clear, side-by-side breakdown for each monitored channel:
- Current Mean vs Baseline Mean — the average reading in your current period compared to your background or previous phase
- % Change — the percentage difference between the two periods, highlighted in red when values are trending upward — an instant visual flag for your team or auditor
- Current Max vs Baseline Max — peak readings in each period, useful for identifying worst-case events
- Current Exceedances vs Baseline Exceedances — how many times thresholds were exceeded in each period, side by side
No spreadsheets. No manual calculations. The table updates automatically as new data comes in — giving you a live, always-current comparison throughout your project.
Why It Matters
1. Demonstrate compliance with confidence
Regulators and clients don’t just want to see that your readings are below a threshold today – they want to see the full picture. Project phase comparison gives you a clear, documented record of how environmental conditions have changed throughout your project, making audits straightforward and defensible.
2. Separate your impact from background conditions
Not every spike in your data is your fault. Construction sites operate in environments with existing noise, dust and vibration from traffic, industry and weather for example. Project phase comparison lets you establish a verified background baseline before works begin — so when readings rise, you can quickly determine whether it’s your activity or an external factor. Combine this with Event Vision video alerts and Pro Link’s automated alerting and you have everything you need to build a solid, defensible case.
3. Manage community and stakeholder concerns
Community complaints are one of the biggest risks on any construction or infrastructure project. When a neighbour complains about dust or noise, the ability to pull up a comparison showing pre-construction versus current conditions – and demonstrate your levels are within agreed limits – is invaluable. It builds trust and reduces conflict.
4. Support project sign-off and handover
At the end of a project, phase comparison data provides clear evidence that the site has returned to pre-construction environmental conditions. This is increasingly required as part of project sign-off, environmental management plans (EMP) compliance and regulatory reporting.
5. Identify trends before they become problems
By comparing data across phases, you can spot gradual increases in dust, noise or vibration levels that might not trigger an alert on any single day – but over time indicate an issue that needs addressing. Early identification means early action.
Summary
Project phase comparison transforms environmental monitoring from a compliance checkbox into a genuine project management tool. It gives you the context to understand your data, the evidence to defend your performance and the insight to act before issues escalate.
Built into Pro Link and running automatically in the background – it’s one of the most powerful features you’re probably not fully using yet.